Published: 2024-04-19T01:59:06.000Z
Chart GBP/USD Update: Under pressure

Technical Analyst
-
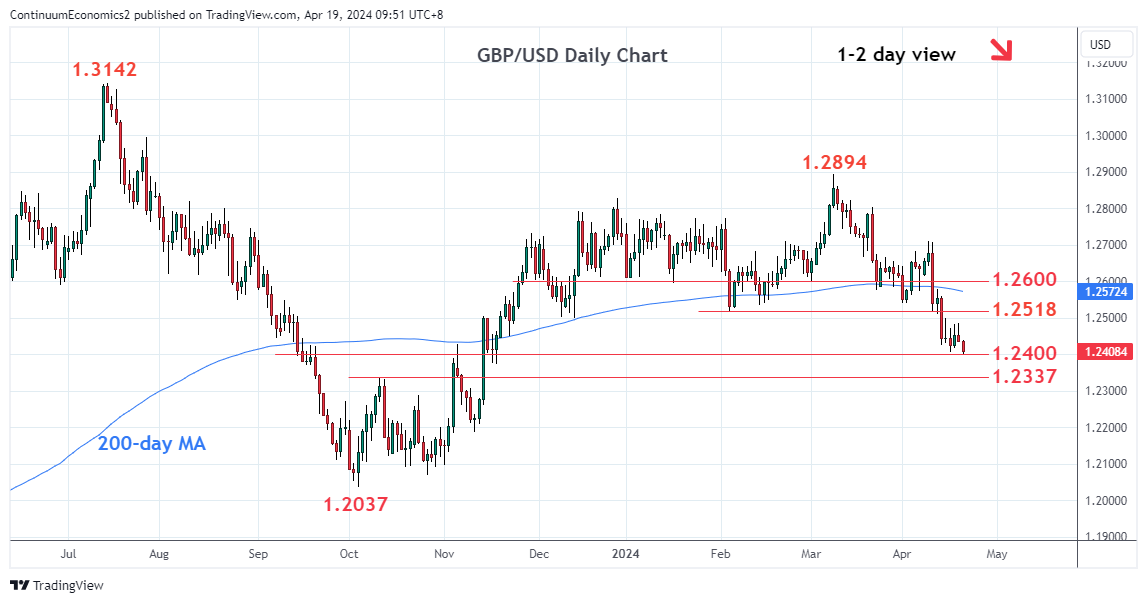
Coming under fresh selling pressure after bounce attempt was checked at the 1.2485
| Level | Comment | Level | Comment | |||||
|---|---|---|---|---|---|---|---|---|
| R4 | 1.2600 | * | congestion | S1 | 1.2405/00 | * | 16 Apr low, figure | |
| R3 | 1.2540 | * | 1 Apr low | S2 | 1.2365 | * | 61.8% Oct/Mar rally | |
| R2 | 1.2500/18 | ** | Dec/Feb lows | S3 | 1.2337 | * | Oct high | |
| R1 | 1.2485 | * | 18 Apr high | S4 | 1.2300 | * | congestion |
Asterisk denotes strength of level
01:50 GMT - Coming under fresh selling pressure after bounce attempt was checked at the 1.2485. Break of the 1.2405/00 support will extend the March losses and see scope to the 1.2365, 61.8% Fibonacci retracement. Lower still will see scope to the strong support at the 1.2337/1.2300, Oct high and congestion. Meanwhile, resistance is lowered to the 1.2485 bounce high then the strong resistance at the 1.2500/18, the December and February lows. Only above the latter will ease the downside pressure and see room for stronger bounce to retrace the steep drop from the 1.2700 level.