Published: 2024-04-19T00:47:41.000Z
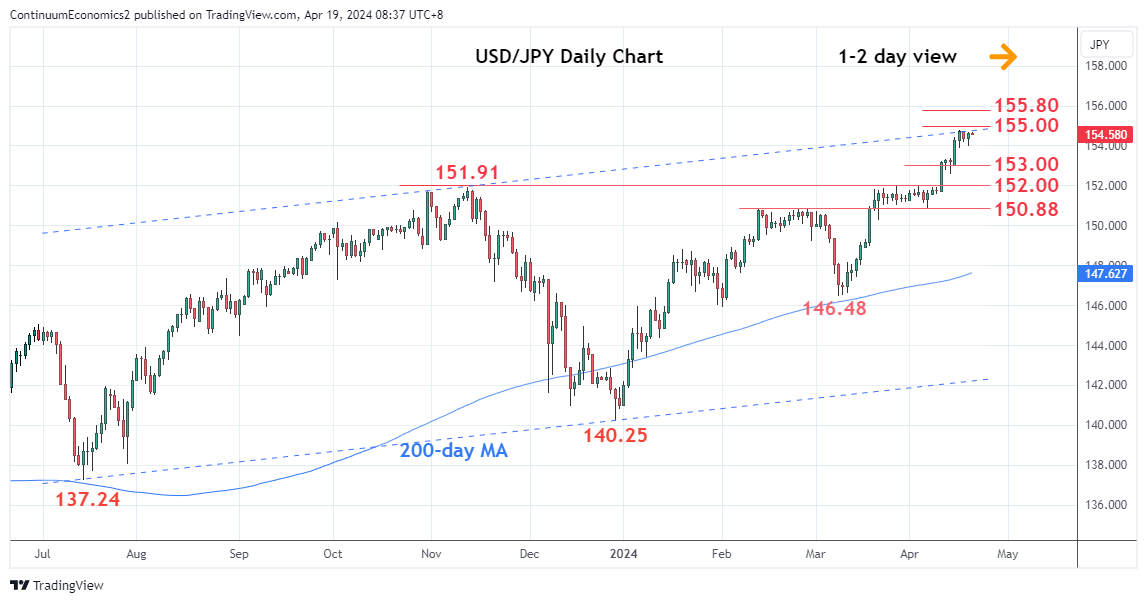
Chart USD/JPY Update: Limited pullback from 154.79 high

Technical Analyst
1
Consolidating test of a 10-month equidistance channel from the July 2023 low at the 154.79 high
| Levels | Imp | Comment | Levels | Imp | Comment | |||
|---|---|---|---|---|---|---|---|---|
| R4 | 155.80 | ** | 25 Jun 1990 high | S1 | 153.88 | 16 Apr low | ||
| R3 | 155.15 | * | 13 Jun 1990 high | S2 | 153.00 | * | congestion | |
| R2 | 155.00 | * | figure | S3 | 152.60 | * | 12 Apr low | |
| R1 | 154.79 | * | 16 Apr YTD high | S4 | 152.00 | ** | congestion |
Asterisk denotes strength of level
00:40 GMT - Consolidating test of a 10-month equidistance channel from the July 2023 low at the 154.79 high as prices unwind the overbought intraday studies Daily studies are stretched as well and caution corrective pullback to support at the 154.00/153.88 area. Would take break here to open up deeper pullback to correct strong run-up from the 146.48, March low. Break will see scope to the 153.00/152.60 area then the 152.00 level. Meanwhile, break above the 154.79 high, if seen, will further extend the underlying bull trend and see scope to 155.00/155.15 area then the 155.80, June 1990 high.